
ABOUT THE PROJECT
It all started with a sensor interface that had real-time data incoming, and I needed to start a server locally to simulate the viewing of these live values. I developed the server on a Raspberry Pi 3B+, which ran the newest Raspbian Buster OS (Linux Based). The client I used to view if my server was working was the UAExpert tool. I was also able to develop Python scripts (my own version of a client) to access specific “nodes” or “sensors” that were connected to my interface and server, and plot them on a live-stream basis using a Dash by Plotly (web-application).
ABOUT THE BUILD OF THE SERVER
The build was completed using SSH Powershell on-board the Raspberry Pi. In order to install some dependencies onto the R-Pi, I used the following commands:
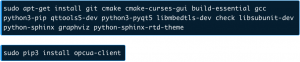
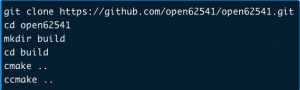
In order to build the server using Open62541 (an open-source implementation of OPC-UA server) I did the following:
Raspberry Pi Local Server Set-Up
ABOUT OPEN62541 OPEN SOURCE C
Open62541 is an open source C (C99) implementation of OPC UA and is useful as it provides a very flexible and adaptable mechanism for moving data between enterprise-type systems and the kinds of controls, monitoring devices and sensors that interact with real-world data. It was of interest me to do this project as a tool-stacking item in my toolbox.
End result: was able to view live-streamed data from over 100 sensors that were connected to an interface remotely.
ABOUT PLOTTING TOOL DEVELOPMENT
Since the data was real-time and I was using a web-application tool (Dash by Plotly) I needed to make sure I created an intelligent architecture for the software so the real-time data incoming from the sensors wouldn’t overload the application. That is where I developed a 20 second circular buffer that would only store that much data prior to cycling and re-filling the buffer with new data points from the selected sensor.
Once there is 20 seconds of data in the circular buffer, the Dash by Plotly web-application I developed (using Python wrapper with HTML/CSS inside of it) would plot the existing points in the buffer and wait for the buffer to continue filling to continue plotting new points.